Probes from A10B.profile.u50 that match brca_er_neg
| Results summary | View all lists in L2L MDB | View all genes in A10B.profile.u50 |
| Results summary | View all lists in L2L MDB | View all genes in A10B.profile.u50 |
|
Genes whose expression is consistently negatively correlated with estrogen receptor status in breast cancer - higher expression is associated with ER-negative tumors enrichment: 1.86-fold |
 |
||||||||||||
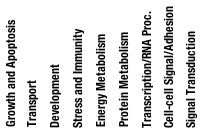
| Probe ID | Name | G | T | D | X | E | P | R | C | S | Description | ||
| 204268_AT | S100A2 | S100 calcium binding protein A2 | |||||||||||
| 203220_S_AT | TLE1 | D | R | S | transducin-like enhancer of split 1 (E(sp1) homolog, Drosophila) | ||||||||
| 215530_AT | FANCA | G | D | X | P | Fanconi anemia, complementation group A | |||||||
| 205428_S_AT | CALB2 | calbindin 2, 29kDa (calretinin) | |||||||||||
| 204269_AT | PIM2 | G | P | S | pim-2 oncogene | ||||||||
| 209122_AT | ADFP | T | E | adipose differentiation-related protein | |||||||||
| 212274_AT | LPIN1 | E | lipin 1 | ||||||||||